NASDAQ $0.00 TSX $0.00

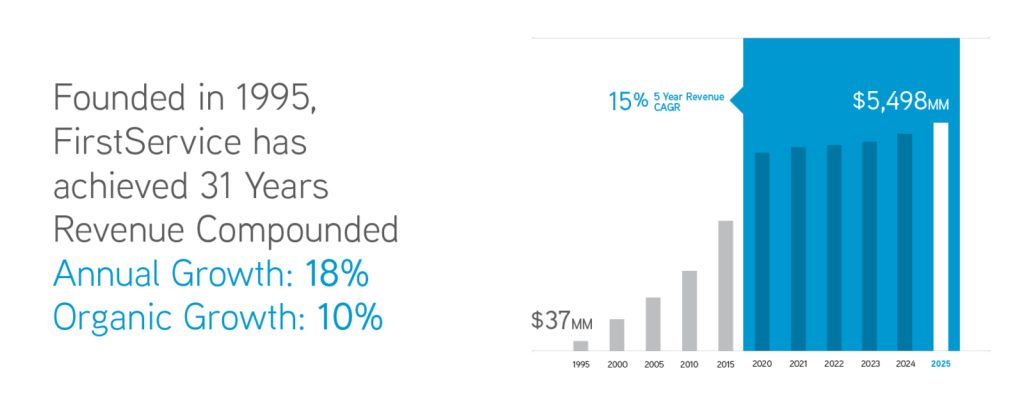
Three decades of compounded annual growth driven primarily by organic growth.
| Year Ended December 31 | |||||
| (US$ thousands, except per share amounts) | 2025 | 2024 | 2023 | 2022 | 2021 |
Operations |
|||||
| Revenues | $5,497,500 | $5,216,894 | $4,334,548 | $3,745,835 | $3,249,072 |
| Operating earnings | $338,078 | $337,512 | $244,892 | $219,026 | $201,642 |
| Net earnings | $190,747 | $187,774 | $147,021 | $145,007 | $156,130 |
Financial position |
|||||
| Total assets | $4,283,713 | $4,194,852 | $3,625,743 | $2,774,514 | $2,509,023 |
| Long-term debt | $1,082,676 | $1,298,710 | $1,182,107 | $734,463 | $652,804 |
| Redeemable non-controlling interests | $486,191 | $449,337 | $332,963 | $233,429 | $219,135 |
| Shareholders’ equity | $1,375,999 | $1,187,746 | $1,024,146 | $907,466 | $799,722 |
Common share data |
|||||
| Net earnings per common share: | |||||
| Basic | $3.19 | $2.98 | $2.25 | $2.74 | $3.08 |
| Diluted | $3.17 | $2.97 | $2.24 | $2.72 | $3.05 |
| Weighted average common shares outstanding (thousands) | |||||
| Basic | 45,527 | 45,019 | 44,556 | 44,175 | 43,841 |
| Diluted | 45,754 | 45,280 | 44,795 | 44,494 | 44,401 |
| Cash dividends per common share | $1.10 | $1.00 | $0.90 | $0.81 | $0.73 |
Other data |
|||||
| Adjusted EBITDA1,3 | $562,795 | $513,690 | $415,728 | $351,732 | $327,376 |
| Adjusted EPS2,3 | $5.75 | $5.00 | $4.66 | $4.24 | $4.57 |
Notes
|
|||||
Our discipline and proven business model has led to more than three decades of consistent growth and solid shareholder returns.
Our companies strive to foster a strong culture that embraces diversity and inclusion, attracts those who share our values and offers opportunities for professional development and growth.
Learn what makes FirstService a leader in outsourced essential property services and our companies’ employers of choice in their respective industries.